在地理空间数据分析中,常用一些模块进行地理数据分析、特征提取及可视化,包括shapely、geopandas、folium、kepler.gl、geohash等工具。
1. shapely
shapely是基于笛卡尔坐标的几何对象操作和分析Python库,底层基于GEOS和JTS拓扑运算库。
1.1 Point对象
|
|
1 2 3 4 5 6 7 8 9 10 11 |
from shapely.geometry import Point point1 = Point(1, 1) point2 = Point(5, 5) point3 = Point(10, 10) #点的可视化 geo.GeometryCollection([point1,point2,point3]) #Point转为numpy数组 print(np.array(point)) |
1.2 LineString对象
|
|
1 2 3 |
# 创建LineString对象 line1 = geo.LineString([(0,0),(2,-2.2),(3,3.3),(4,-4.4),(5,-5.5),(6,6.6)]) line1 |
|
|
1 2 3 4 5 |
#点和线的可视化 geo.GeometryCollection([line1,Point(1,1)]) #计算点线或线线的最短距离 print ('点线距离:'+str(Point(1,1).distance(line1))) |
|
|
1 2 3 |
#几何中心 center = line1.centroid geo.GeometryCollection([line1,center]) |
|
|
1 2 3 |
#几何对象的最小外接矩形 b_rect = line1.envelope geo.GeometryCollection([line1,b_rect]) |
|
|
1 2 3 |
#简化线(Douglas-Pucker算法) line1_simplify = line1.simplify(0.4, preserve_topology=False) line1 |
|
|
1 2 3 |
#生成线的缓冲区 buffer_with_circle = line1.buffer(0.3) geo.GeometryCollection([line1,buffer_with_circle]) |
1.3 LinearRings对象
|
|
1 2 3 4 |
from shapely.geometry.polygon import LinearRing ring = geo.polygon.LinearRing([(0, 0), (1, -1), (1, 0)]) geo.GeometryCollection([ring]) |
1.4 Polygon对象
|
|
1 2 3 4 |
from shapely.geometry import Polygon poly1 = Polygon([(0,0),(2,0),(1,-1),(-3,1),(0,0)]) #起点和终点相同 poly1 |
|
|
1 2 3 4 |
#通过numpy生成多边形 coords = np.array([(0,0),(1,0.1),(2,0),(1,2),(0,0)]) poly2 = Polygon(coords) poly2 |
|
|
1 2 |
#多个polygon的集合 geo.GeometryCollection([poly1,poly2]) |
|
|
1 2 3 |
#几何中心 center = poly1.centroid #几何中心 geo.GeometryCollection([center,poly1]) |
|
|
1 2 3 |
#最小外接矩形 rect = poly1.minimum_rotated_rectangle #最小外接矩形 geo.GeometryCollection([rect,poly1]) |
|
|
1 |
poly2.simplify(0.5)#简化面 |
|
|
1 2 3 4 5 6 7 8 |
r1 = poly2.contains(point2) #面点关系 print(r1) r2 = poly2.intersects(line1) #面线关系 print(r2) r3 = poly1.intersects(poly2) #面面关系 print(r3) |
|
|
1 2 3 |
poly1.intersection(poly2) #面面交集 poly1.union(poly2) #面面并集 poly2.difference(poly1) #面面补集 |
2. geopandas
geopandas是pandas在地理数据处理领域的扩展包,其核心数据结构是GeoSeries和GeoDataFrame。
geopandasd 主要功能为:
1.文件读写
2.空间查询
3.坐标转换
4.空间join
5.地理数据可视化
2.1 文件读写
geopandas可读geojson和shp等空间文件,也可读含有geometry字段的csv文件。
|
|
1 2 3 4 5 6 |
import numpy as np import pandas as pd import shapely import geopandas as gpd from shapely import wkt from shapely import geometry as geo |
|
|
1 2 3 4 |
#读取geojson countries = gpd.read_file("dfcountries.geojson",bbox = [-180,-80,180,80]) countries.plot()#显示图 countries #显示表格 |
|
|
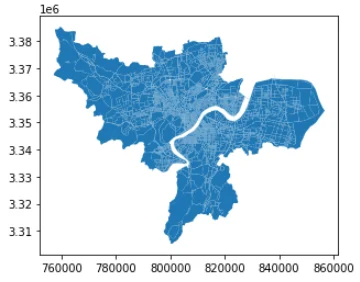
1 2 3 4 |
#读取shp cities = gpd.GeoDataFrame.from_file('./cities.shp', encoding='utf-8') cities.plot()#显示图 cities #显示表格 |
|
|
1 2 3 4 5 6 |
#保存成geojson countries.to_file("dfcountries.geojson",driver = "GeoJSON") #保存成csv cities.to_csv("dfcountries.csv",index = False,sep = "\t") #保存成shp cities.to_file(".a/cities.shp") |
|
|
1 2 3 4 5 |
#按值的大小填充颜色 import matplotlib.pyplot as plt fig, ax = plt.subplots(figsize=(9,6),dpi = 100) cities.plot('area',ax = ax,legend = True) plt.show() |

3.Folium
folium是一种交互式动态地图接口,可以用来画热力图、填充地图、路径图、散点标记等图。
|
|
1 2 3 4 5 |
import folium import os #指定坐标中心和缩放尺寸,生成交互式地图 m = folium.Map(location=[30.33,120.37],zoom_start=10) m |

|
|
1 2 3 4 5 6 |
from folium.plugins import HeatMap #生成随机数据,指定坐标中心和缩放尺寸,生成热力图 data=(np.random.normal(size=(100,3))*np.array([[1,1,1]])+np.array([[30.33,120.37,1]])).tolist() m=folium.Map([30.33,120.37],tiles='Stamen Toner',zoom_start=6) HeatMap(data).add_to(m) m |

folium的MarkerCluster()聚类函数,可以用来反映一个区域的拥挤程度。
|
|
1 2 3 4 5 6 7 8 9 10 11 12 |
from folium.plugins import MarkerCluster #创建对象 marker_cluster = MarkerCluster().add_to(m) #将经纬度加入聚类 for element in data: folium.Marker(location=[element[0], element[1]],icon=None).add_to(marker_cluster) #添加至地图 m.add_child(marker_cluster) m |
4.Kepler.gl
Kepler.gl是Uber联合Mapbox推出的地理空间可视化工具,支持3种数据格式:CSV、JSON、GeoJSON。接下来将以杭州市OSM路网为例,制作路径流动动画。
|
|
1 2 3 |
from keplergl import KeplerGl import json import time |
|
|
1 2 3 |
#读取geojson with open('./hzroad.json',encoding='gb18030', errors='ignore') as g: raw_roads = json.load(g) |
|
|
1 2 3 4 5 6 7 8 9 10 11 12 |
#生成虚构时间戳信息和高度0 start_time = time.mktime(time.strptime('2020-05-29 20:00:00', "%Y-%m-%d %H:%M:%S")) for i in range(raw_roads['features'].__len__()): for j in range(raw_roads['features'][i]['geometry']['coordinates'].__len__()): # 更新当前对应的时间戳 shift_time = int((j / raw_roads['features'][i]['geometry']['coordinates'].__len__())*3600) # 高度设置为0 raw_roads['features'][i]['geometry']['coordinates'][j] \ .extend([0, int(start_time) + shift_time]) |
|
|
1 2 3 4 5 6 |
from keplergl import KeplerGl # 生成KeplerGl对象 m = KeplerGl(height=400, data={'flow': raw_roads}) # data以图层名为键,对应的矢量数据为值 m m.save_to_html(file_name='./hangzhou.html') |
5.Geohash
GeoHash是一种地址编码方法,可以将地理经纬度坐标编码为由字母和数字所构成的字符串。其原理类似哈希表:由于遍历列表查找时间复杂度高,而创建散列函数能够更高效地定位数据。而GeoHash将二维的经纬度坐标编码到一维的字符串中,在做地理位置索引时只需匹配字符串,便于信息的缓存和压缩。
GeoHash采用二分法不断缩小经度和纬度的区间来进行二进制编码,最后将经纬度分别产生的编码奇偶位交叉合并,再用字母数字表示。

p.s. 酷炫动图见公众号