在地理空间数据分析中,常用一些模块进行地理数据分析、特征提取及可视化,包括shapely、geopandas、folium、kepler.gl、geohash等工具。
1. shapely
shapely是基于笛卡尔坐标的几何对象操作和分析Python库,底层基于GEOS和JTS拓扑运算库。
1.1 Point对象
1 | from shapely.geometry import Point |
1.2 LineString对象
1 | # 创建LineString对象 |
1 | #点和线的可视化 |
1 | #几何中心 |
1 | #几何对象的最小外接矩形 |
1 | #简化线(Douglas-Pucker算法) |
1 | #生成线的缓冲区 |
1.3 LinearRings对象
1 | from shapely.geometry.polygon import LinearRing |
1.4 Polygon对象
1 | from shapely.geometry import Polygon |
1 | #通过numpy生成多边形 |
1 | #多个polygon的集合 |
1 | #几何中心 |
1 | #最小外接矩形 |
1 | poly1.boundary#边缘 |
1 | poly2.simplify(0.5)#简化面 |
1 | r1 = poly2.contains(point2) #面点关系 |
1 | poly1.intersection(poly2) #面面交集 |
2. geopandas
geopandas是pandas在地理数据处理领域的扩展包,其核心数据结构是GeoSeries和GeoDataFrame。
geopandasd 主要功能为:
1.文件读写
2.空间查询
3.坐标转换
4.空间join
5.地理数据可视化
2.1 文件读写
geopandas可读geojson和shp等空间文件,也可读含有geometry字段的csv文件。
1 | import numpy as np |
1 | #读取geojson |
1 | #读取shp |
1 | #保存成geojson |
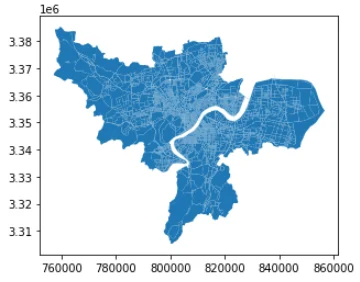
1 | #按值的大小填充颜色 |

3.Folium
folium是一种交互式动态地图接口,可以用来画热力图、填充地图、路径图、散点标记等图。
1 | import folium |

1 | from folium.plugins import HeatMap |

folium的MarkerCluster()聚类函数,可以用来反映一个区域的拥挤程度。
1 | from folium.plugins import MarkerCluster |
4.Kepler.gl
Kepler.gl是Uber联合Mapbox推出的地理空间可视化工具,支持3种数据格式:CSV、JSON、GeoJSON。接下来将以杭州市OSM路网为例,制作路径流动动画。
1 | from keplergl import KeplerGl |
1 | #读取geojson |
1 | #生成虚构时间戳信息和高度0 |
1 | from keplergl import KeplerGl |
5.Geohash
GeoHash是一种地址编码方法,可以将地理经纬度坐标编码为由字母和数字所构成的字符串。其原理类似哈希表:由于遍历列表查找时间复杂度高,而创建散列函数能够更高效地定位数据。而GeoHash将二维的经纬度坐标编码到一维的字符串中,在做地理位置索引时只需匹配字符串,便于信息的缓存和压缩。
GeoHash采用二分法不断缩小经度和纬度的区间来进行二进制编码,最后将经纬度分别产生的编码奇偶位交叉合并,再用字母数字表示。

p.s. 酷炫动图见公众号
